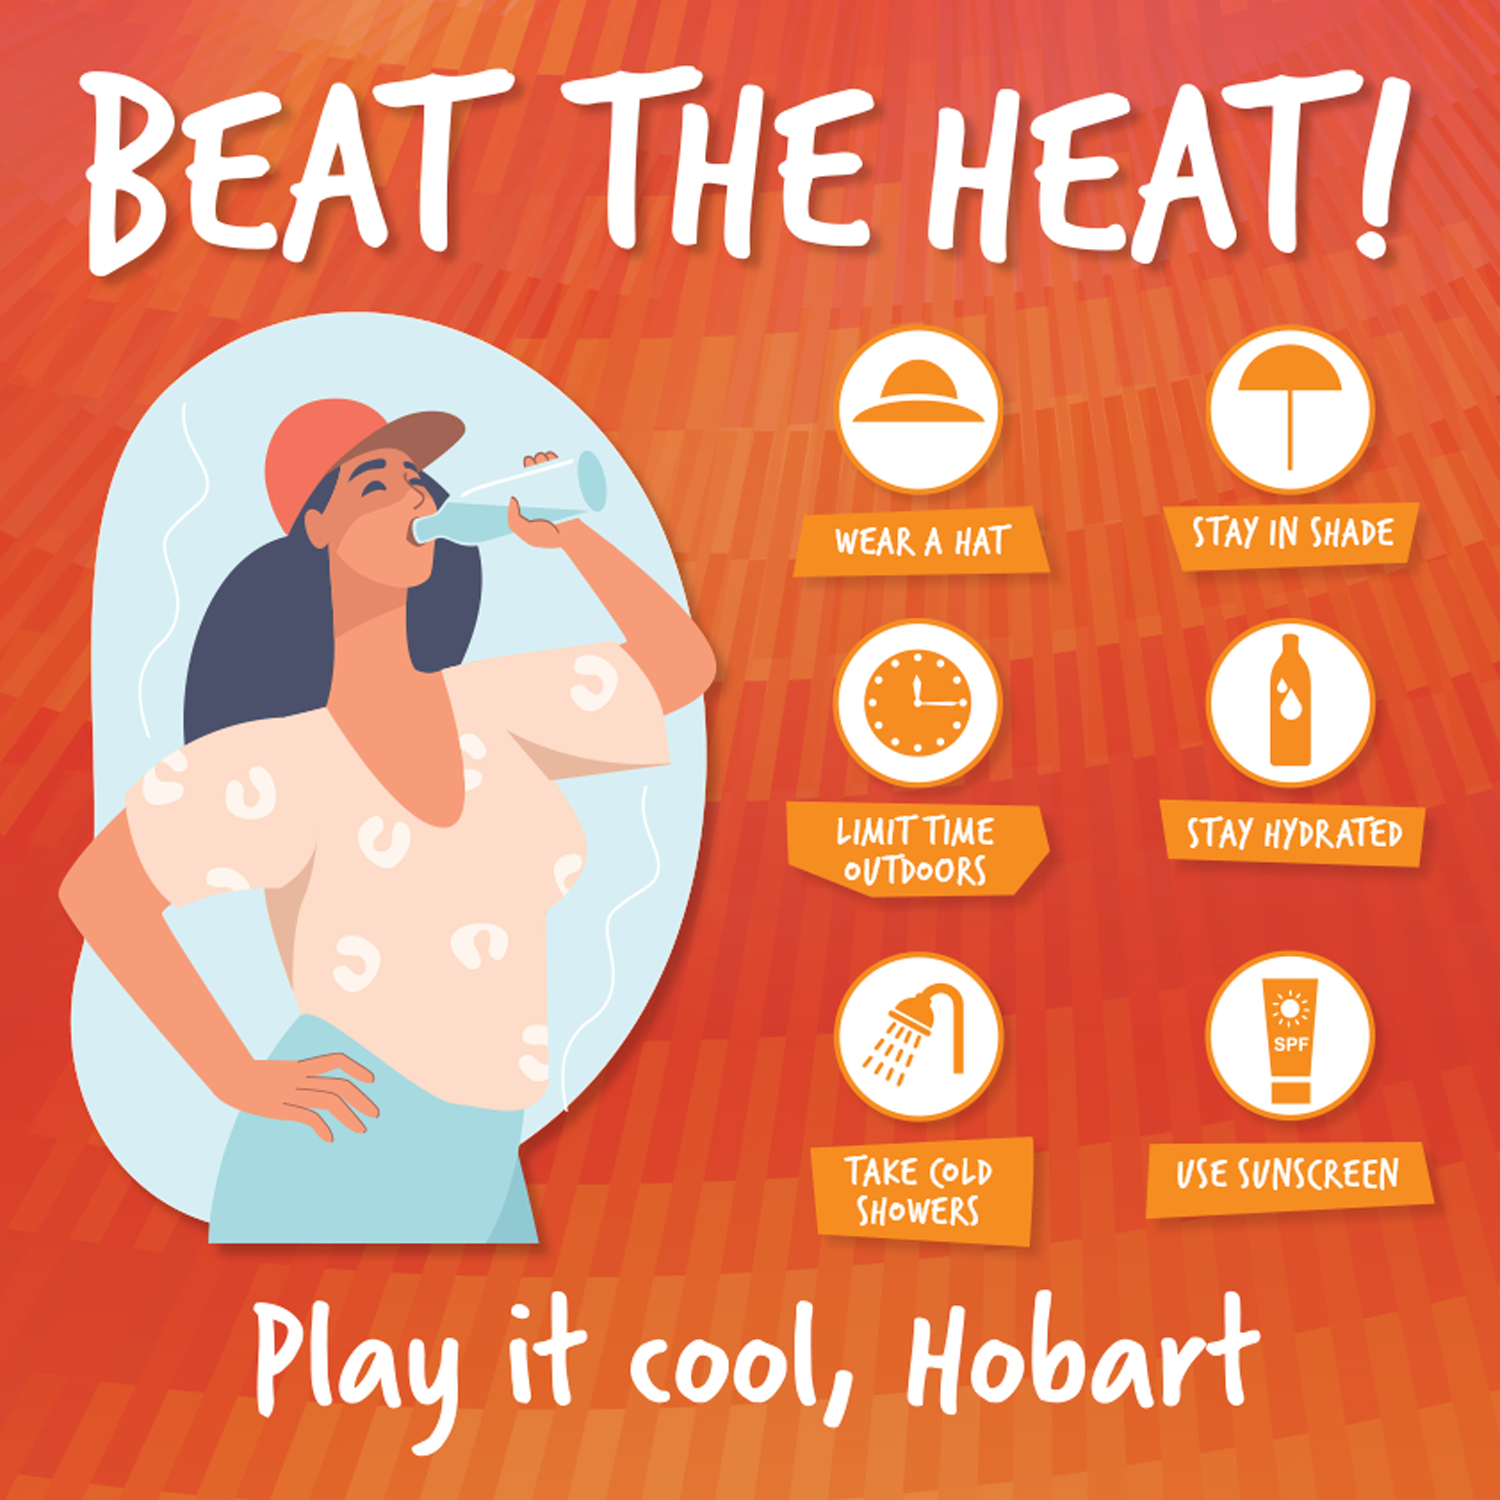
This week the City of Hobart launched its new residential heat risk mapping alongside the Beat the Heat public education campaign—timed with a run of hot weather across Greater Hobart.
Geoneon worked with the City to turn complex climate and demographic data into a suburb-by-suburb, building-level view of where heat risk is highest - so the City and the community can better target practical actions that reduce heat exposure and protect vulnerable residents.
What the mapping shows
The 2025 Hobart Residential Heat Risk Report finds that nearly a quarter of Hobart’s residential buildings fall within the highest heat risk categories (risk index 8–9; none were classified as index 10).
At a suburb level, the largest concentrations of high-risk homes are in:
-
New Town (1,621 high-risk buildings)
-
Sandy Bay (1,011)
-
Lenah Valley (1,002)
Other suburbs identified with elevated risk include Mount Stuart, West Hobart, Dynnyrne, South Hobart, Hobart CBD, and Battery Point.
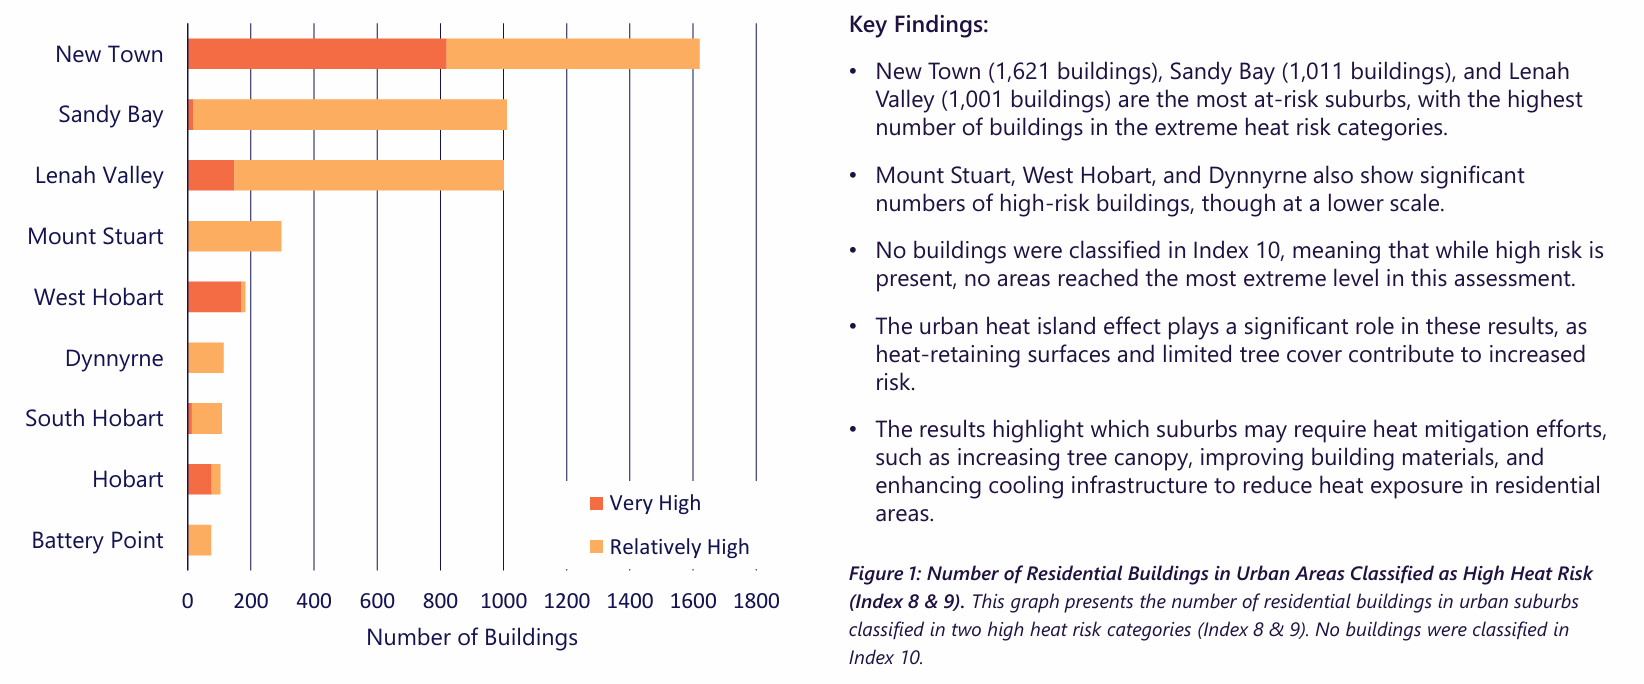
A consistent theme across the analysis is that heat risk is overwhelmingly an urban issue. In the report, almost all buildings classified in the highest risk categories are in urban areas - reflecting the combined effects of heat-retaining materials, limited greenery, and neighbourhood form.
How the heat risk index works
Heat risk is not just “where it gets hot” - it is also who is most exposed and most vulnerable.
To make this measurable and comparable across the city, the report builds four indices (each scored 1–10):
-
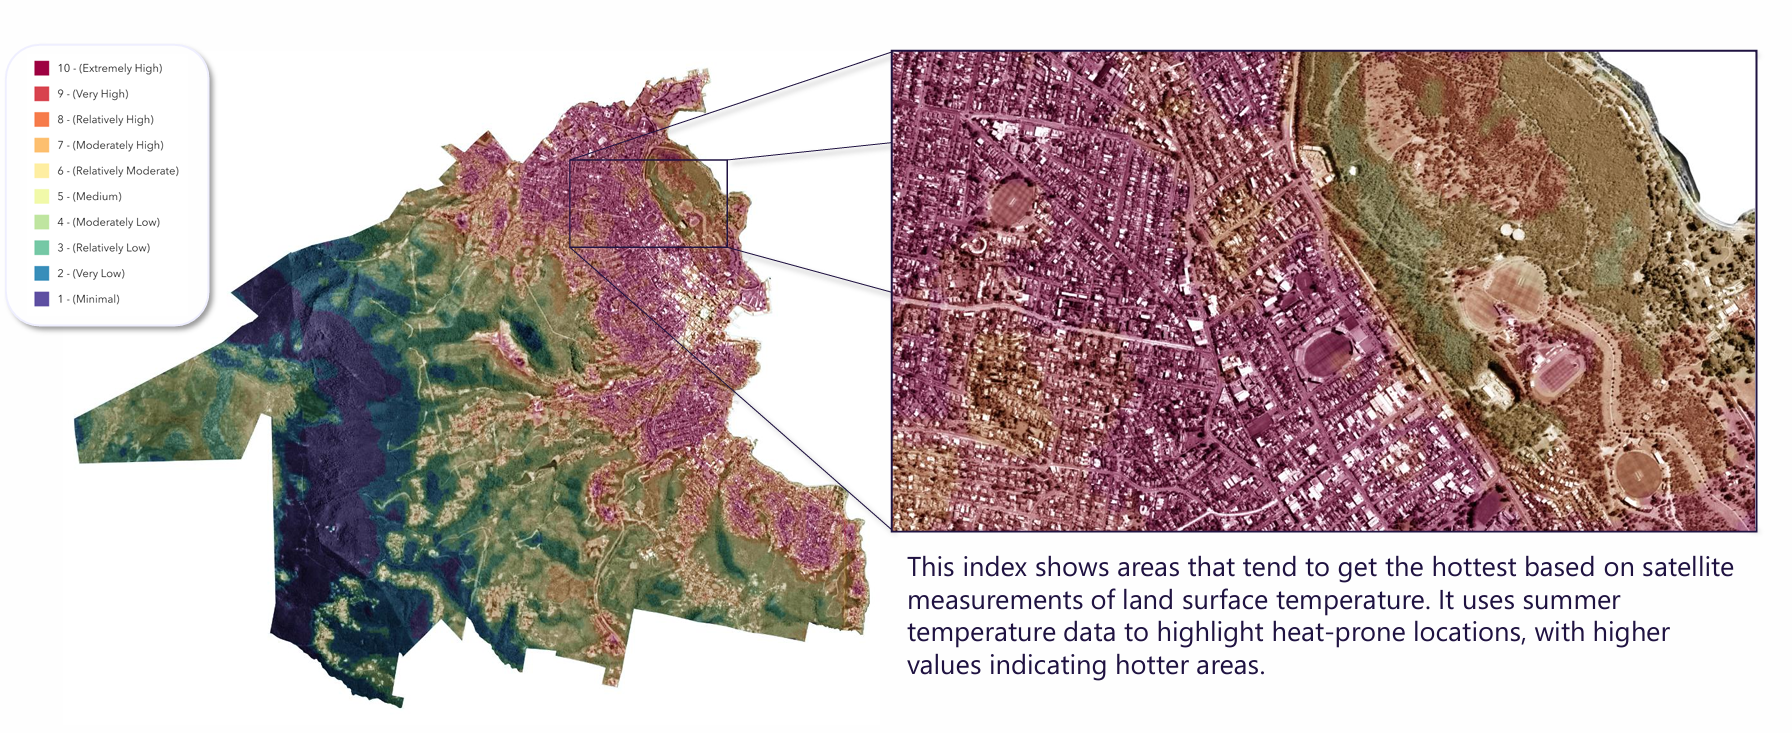
Heat Susceptibility Index
Where the urban landscape tends to heat up most, using satellite-derived land surface temperature. -
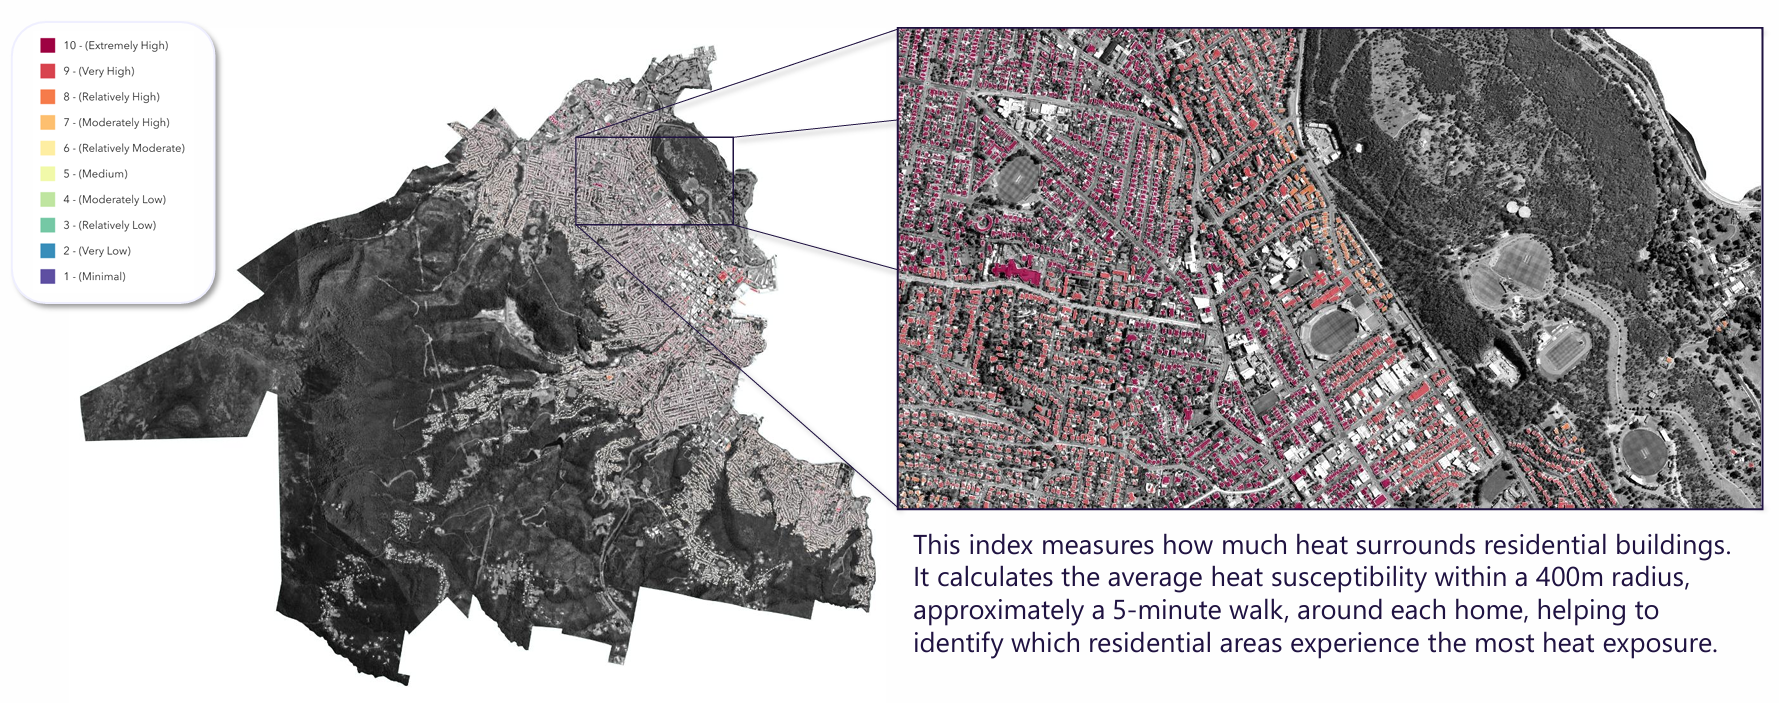
Heat Exposure Index
How much heat surrounds a home, calculated across a ~400 m neighbourhood buffer (about a 5-minute walk). -
Social Vulnerability Index
A measure of sensitivity to heat, considering factors such as age distribution and socioeconomic disadvantage. -
Residential Heat Risk Index
A combined index that highlights where high exposure and high vulnerability overlap.
This structure is important because it helps decision-makers move from “interesting climate maps” to actionable prioritisation - for example, targeting community outreach, cooling infrastructure, and greening interventions where they will have the biggest impact.
Why tree canopy matters
Urban heat risk is closely tied to shade and greenery. Tree canopy can reduce heat exposure at street level and around homes - especially along walking routes and in areas where people spend time outdoors during hot weather.
Hobart City Council has already published tree canopy results for 2017–2022 in its State of the Canopy reporting. That public mapping shows:
-
Urban canopy cover decreased from 31% (2017) to 29% (2022) — a 2% decline overall.
-
The reported canopy loss occurred on private land, while canopy on public land remained broadly stable over the same period.
-
Canopy is unevenly distributed across suburbs; for example, the City notes very low-canopy suburbs such as Hobart and North Hobart (less than 10% canopy).
These public results support the City’s longer-term goal to increase urban canopy cover to 40% by 2046.
Note: Geoneon has also produced updated canopy monitoring work for the City beyond the 2017–2022 reporting period, but that newer canopy analysis has not been publicly released. For now, we are linking to the City’s official public canopy resources below.
What happens next
The value of heat risk mapping is in what it enables next:
-
Public education that reaches the right communities (Beat the Heat)
-
Smarter greening programs (where planting, shade, and cooling investments will matter most)
-
Better urban design decisions (materials, street corridors, and development planning that reduces heat retention over time)
Geoneon is proud to support the City of Hobart with data that is both scientifically grounded and usable for action- and we are excited to see this work entering the public conversation through the campaign, the media coverage, and community distribution of Beat the Heat materials.
References
-
Media coverage: the launch was featured on WIN News and was a lead story in The Mercury (published 28 Jan 2026).
-
Listen back: ABC Radio Hobart also covered the findings (Roxane Bandini-Maeder interviewed on Hobart Drive): https://www.abc.net.au/listen/programs/hobart-drive/drive/106266466
- City media release (launch): https://www.hobartcity.com.au/Council/News-and-publications/Media-releases/Revealed-Hobart-suburbs-most-at-risk-from-summer-heat-shocks
- Beat the Heat campaign hub (includes downloads + advice): https://www.hobartcity.com.au/Environment-and-Sustainability/Emergency-management/Heatwaves-and-hot-weather
- Residential Heat Risk Map: https://hobartcc.maps.arcgis.com/apps/instant/basic/index.html?appid=2d422a3366464a67b00e6277295a852e
- 2025 Hobart Residential Heat Risk Report (PDF): https://www.hobartcity.com.au/files/assets/public2/v/2/environment-and-sustainability/emergency-management/heatwaves-and-hot-weather/hobart-residential-heat-risk-report-mapping-climate-risks.pdf
- Beat the Heat – social media tile (PNG): https://www.hobartcity.com.au/files/assets/public2/v/1/environment-and-sustainability/emergency-management/heatwaves-and-hot-weather/beat-the-heat-social-tile.png
- Beat the Heat – poster (PDF): https://www.hobartcity.com.au/files/assets/public2/v/1/environment-and-sustainability/emergency-management/heatwaves-and-hot-weather/beat-the-heat-poster.pdf
- Beat the Heat – brochure (PDF): https://www.hobartcity.com.au/files/assets/public2/v/1/environment-and-sustainability/emergency-management/heatwaves-and-hot-weather/beat-the-heat-brochure.pdf
- State of the Canopy (City page): https://www.hobartcity.com.au/Council/Vision-and-strategies/Strategies-plans-and-reports/State-of-the-Canopy-report
- Urban Tree Strategy 2025 (Your Say Hobart): https://yoursay.hobartcity.com.au/urban-tree-strategy-2025
- Urban Tree Strategy 2025 – documents (includes State of the Canopy PDF link as well):
https://yoursay.hobartcity.com.au/urban-tree-strategy-2025/documents - Increasing the tree canopy (City page): https://yoursay.hobartcity.com.au/urban-tree-strategy-2025/documents