Understanding how vegetation changes over time is important for environmental management, wildfire risk assessment, and conservation planning. Geoneon has now completed the January 2023 vegetation height dataset for all of Tasmania, including its islands, building upon our January 2024 dataset. This enables us to analyse year-on-year vegetation changes—identifying areas where clearing has occurred, where regrowth is happening, and where landscapes are shifting.
We are also actively preparing the January 2025 dataset, ensuring continuous monitoring of Tasmania’s vegetation.
How We Map Vegetation Height Over Time
Geoneon’s datasets are based on Sentinel-2 satellite imagery, using deep learning to estimate vegetation height at a 10m horizontal resolution. Each dataset is derived from a cloud-free mosaic of images collected over a three-month period:
- January 2023 dataset → Sentinel-2 imagery acquired between October and December 2022
- January 2024 dataset → Sentinel-2 imagery acquired between October and December 2023
- January 2025 dataset → Currently in preparation, using imagery from October to December 2024
By standardising our data collection period each year, we ensure consistent and comparable vegetation height estimates.
Detecting Changes in Vegetation Cover
With both January 2023 and January 2024 datasets available, we can now analyse:
- Deforestation & Land Clearing – Identify areas where vegetation has been removed for agriculture, urban development, or infrastructure projects.
- Regrowth & Reforestation – Detect areas where forests and vegetation are recovering.
- Fire Impact & Recovery – Assess vegetation changes in fire-affected regions to support post-fire restoration efforts.
- Vegetation Trends Over Time – Establish baseline conditions for tracking long-term ecological shifts.
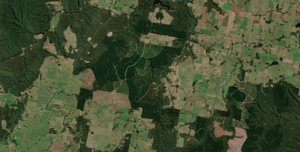
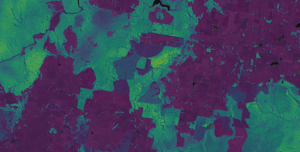
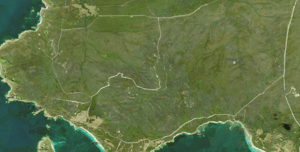
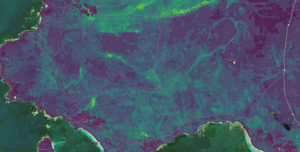
Sentinel-2 imagery and Geoneon’s vegetation height model (January 2023) for a forestry area in Tasmania.
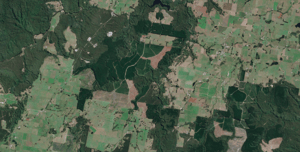
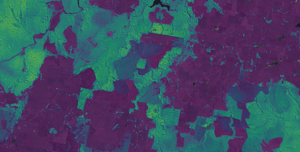
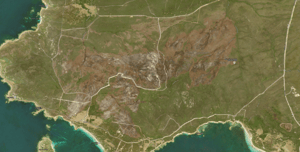
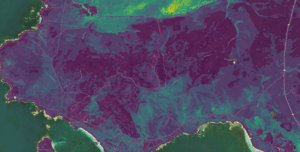
Sentinel-2 imagery and Geoneon’s vegetation height model (January 2024) of the same forestry area. Comparison with 2023 reveals areas of vegetation loss due to clearing.

Vegetation height difference map (2023–2024) highlighting areas of clearing in the forestry zone. Reductions in height values indicate zones where significant canopy loss occurred between January 2023 and January 2024.
Vegetation height and satellite imagery of Mount Tanner, Flinders Island, prior to the October 2023 bushfire. Dense and continuous vegetation is visible, indicating substantial biomass before the fire event.
Post-fire comparison of vegetation height and satellite imagery of Mount Tanner, Flinders Island, after the October 2023 bushfire. Significant vegetation loss is evident, with cleared areas and reduced canopy height following the fire's impact.
Key Applications & Benefits
Wildfire Risk Assessment
Changes in vegetation height directly impact fuel loads and fire behaviour modelling. Emergency services can use this data to:
- Identify high-risk areas where tall vegetation has increased.
- Monitor vegetation clearance efforts to assess effectiveness in fire mitigation.
Conservation & Biodiversity Management
Vegetation height is a critical indicator of habitat structure. Conservationists and ecologists can use this dataset to:
- Track forest loss and habitat changes affecting wildlife.
- Support reforestation programs by monitoring vegetation regrowth.
Urban & Regional Planning
Urban planners and local councils can use the dataset to:
- Assess changes in tree canopy coverage and green spaces.
- Monitor land clearing trends for infrastructure projects.
- Support urban heat mitigation strategies by ensuring green cover is maintained.
Carbon Estimation & Climate Resilience
Vegetation height data supports carbon stock estimation by measuring biomass. This helps in:
- Tracking deforestation emissions and carbon sequestration.
- Supporting climate action plans for sustainable land management.
Access the Data
Geoneon’s vegetation height datasets are now available. If you are interested in accessing this data or discussing its applications, get in touch with us!