GEONEON VEGETATION
Smarter Vegetation Intelligence. From Space to Street Trees.
Natural hazards—such as wildfire, floods, and landslides—present significant risks to communities around the globe. While we cannot prevent these events from occurring, advancements in susceptibility analysis allow us to predict where they are most likely to happen, providing an invaluable tool for disaster preparedness and risk reduction. This blog post delves into the concept of susceptibility in natural hazards, exploring its definition, the evolution of analysis methods, the integration of data-driven models, and the future direction of research in this vital field. By understanding and improving susceptibility analysis, we can better safeguard lives and properties against the inevitable occurrence of natural disasters.
Susceptibility measures the likelihood of a natural hazard occurring in a specific area, considering local environmental conditions and historical data. It doesn't predict when or how often hazards will occur but identifies potential future locations of such events. As defined by (Brabb, 1985), susceptibility is "the estimation of the likelihood of spatial occurrence of natural hazard evaluated on the basis of terrain and environmental conditions”.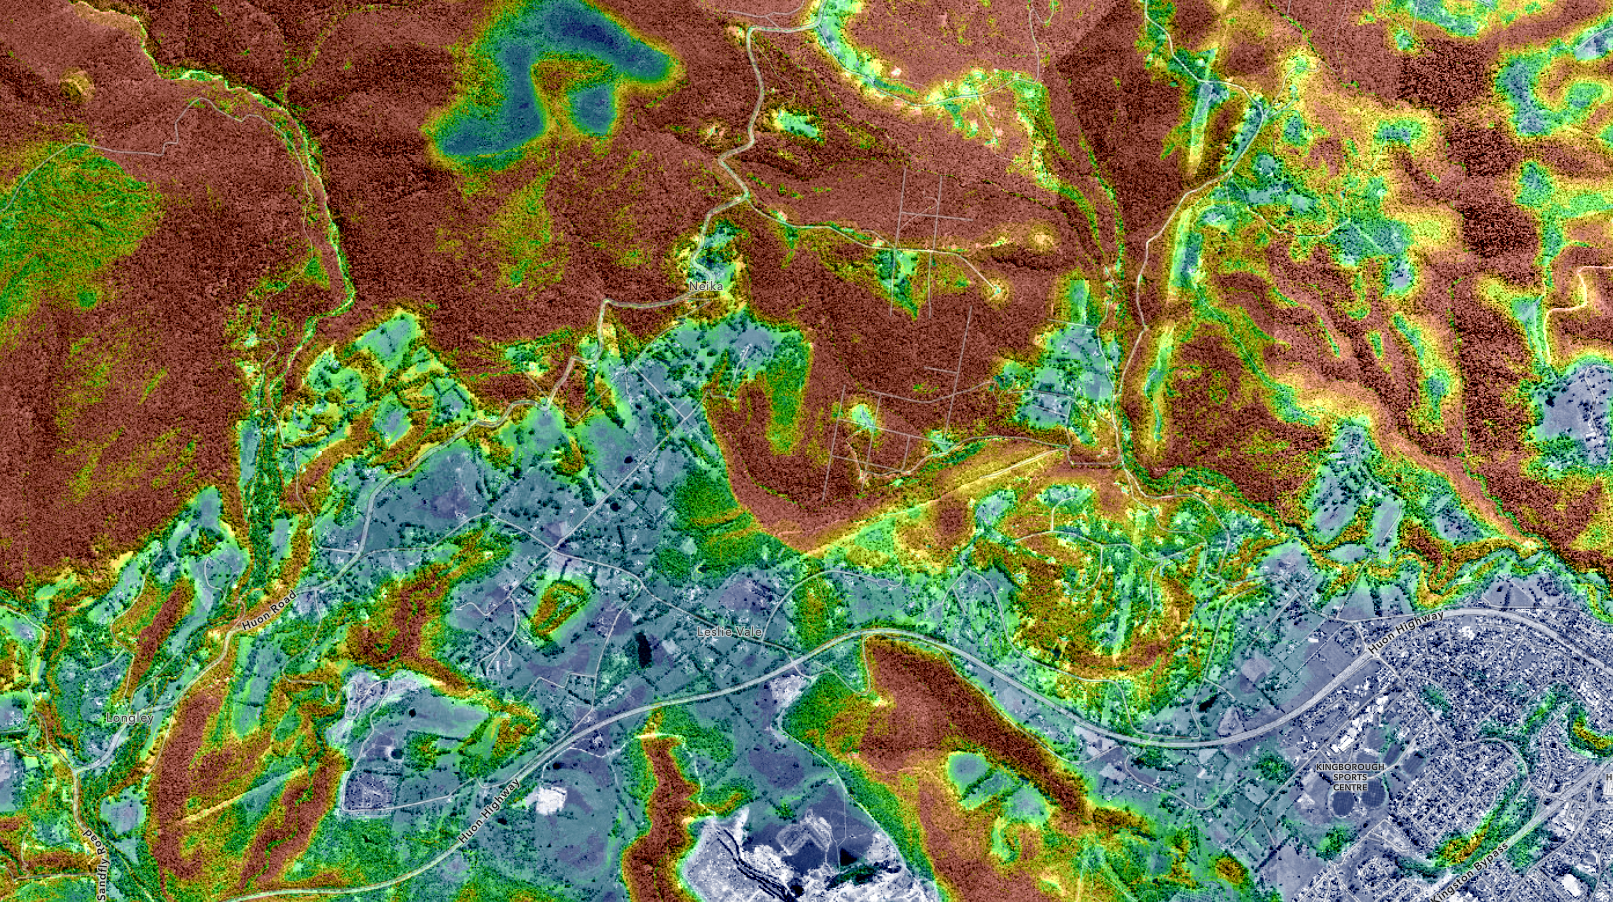
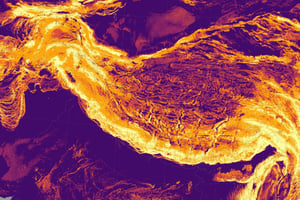
Wildfire Severity Susceptibility Map. This map categorises different areas based on their relative likelihood to experiencing severe wildfires, taking into account factors like vegetation type density, and topography. This map emphasises the inherent susceptibility based on static or slowly changing conditions of the landscape, while "hazard severity" indicates the potential impact level of wildfires in these susceptible areas.
At their core, the philosophy and methodology behind hazard maps and susceptibility maps differ significantly, both in purpose and application. Here is a simplified breakdown:
The table below summarises the differences between hazard and susceptibility maps:
| Feature | Susceptibility Maps | Hazard Maps |
|---|---|---|
| Definition | Identify areas prone to hazards based on inherent environmental and geological conditions. | Predict specific natural events, their intensity, and potential impact within a timeframe. |
| Advantages |
|
|
| Disadvantages |
|
|
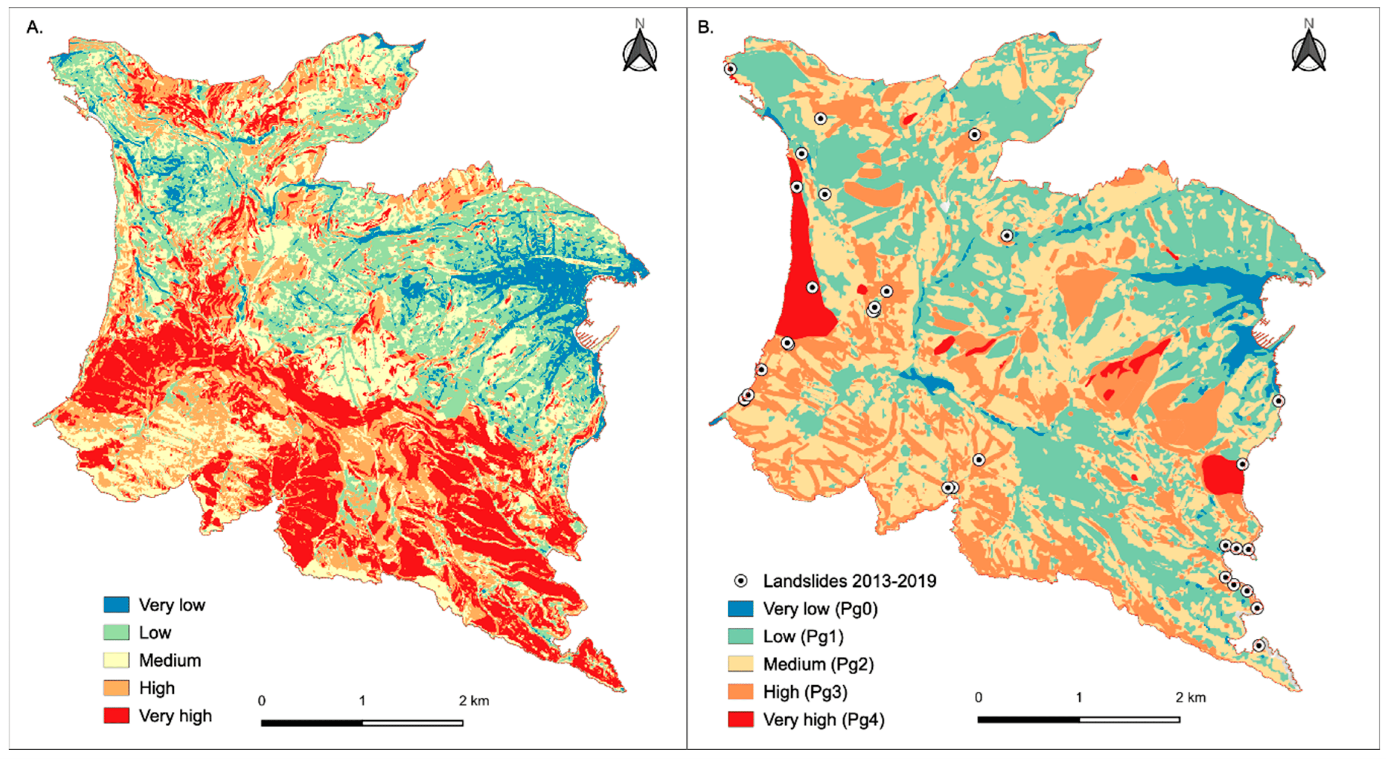
Comparing Susceptibility and Hazard Maps. Side-by-side comparison between: (A) the landslide susceptibility map, and (B) the landslide hazard zonation currently adopted by the regional land and risk management plan in the Portofino promontory, a Mediterranean area that is periodically hit by intense rain events that induce often shallow landslides. Black dots represent rainfall induced landslides which occurred after 2013 (Roccati et al 2021).
These distinctions highlight the complementary nature of hazard and susceptibility maps in comprehensive risk management and disaster preparedness strategies.
While susceptibility maps provide a broader understanding of inherent risk factors across the landscape, hazard maps offer insights into the potential timing and impact of events.
The concept of susceptibility analysis has roots that stretch back to the early days of environmental and geological sciences, evolving significantly over the decades through scientific breakthroughs and technological advancements.
The initial steps toward understanding natural hazard susceptibility can be traced back to geological and environmental observations made in the 18th and 19th centuries. Early geologists like James Hutton and Charles Lyell laid the groundwork with their observations on earth processes, emphasising the importance of understanding the Earth's surface for predicting geological hazards.
The 20th century saw a more systematic approach to susceptibility analysis, particularly with the advent of the field of geomorphology and the application of statistical methods to geological problems. Pioneers like Arthur Holmes in the early 1940s advocated for the use of quantitative methods in geology, setting the stage for later developments in hazard analysis.
The introduction of the concept of "risk" in the mid-20th century, particularly by engineers and geologists working on landslide susceptibility and earthquake prediction, marked a significant evolution. Key works, such as those by Brabb et al. (1972) on landslide susceptibility mapping, began to integrate statistical analysis with geological and hydrological data, laying the foundation for modern susceptibility analysis.
The 1980s and 1990s witnessed a revolution in susceptibility analysis with the advent of Geographic Information Systems (GIS) and remote sensing technology. These tools allowed for the collection, storage, and sophisticated analysis of large datasets, significantly enhancing the ability to analyse and map susceptibility to various natural hazards. Pioneering studies, such as those by Carrara et al. (1991) and Guzzetti et al. (1999), utilised GIS to develop more accurate and detailed susceptibility maps.
The digital age has brought about exponential growth in data availability and computational power.
Machine learning and artificial intelligence (AI) have become increasingly important in susceptibility analysis, enabling the analysis of complex datasets and the development of predictive models with greater accuracy and efficiency.
Studies by Lombardo et al. (2020) and others have demonstrated the application of machine learning techniques in improving landslide susceptibility maps, earthquake prediction models, and flood risk assessment.
Data-driven models have become a cornerstone in the field of susceptibility analysis, leveraging vast datasets and computational algorithms to predict natural hazard susceptibilities. These models fall broadly into two categories: probabilistic models and machine learning algorithms.
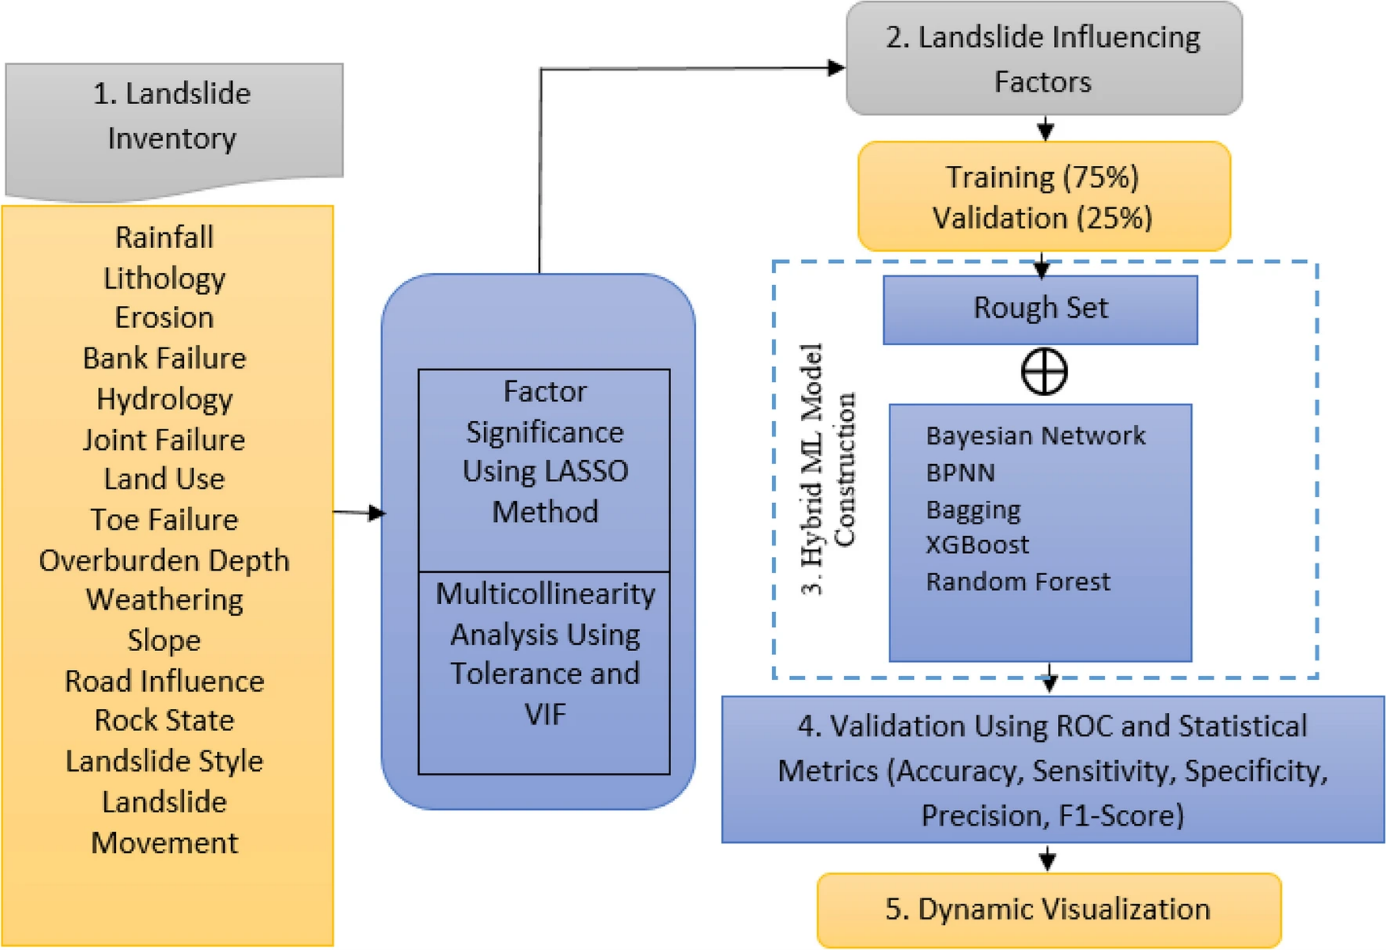
The Machine Learning Process in Susceptibility Analysis. Methodological flowchart showing different steps for the construction of hybrid machine learning models for the prediction of landslide events (Kainthura and Sharma 2022).
Probabilistic models assess the likelihood of natural hazard occurrences by considering the statistical relationships between past events and the conditions that led to those events. They are particularly useful in areas with extensive historical records, allowing for the estimation of hazard probabilities based on observed patterns.
One notable application of probabilistic models is in the assessment of earthquake susceptibility. The United States Geological Survey (USGS) employs probabilistic seismic hazard analysis (PSHA) to estimate earthquake probabilities in the United States, informing building codes and insurance rates (USGS, ongoing). This method considers the locations, magnitudes, and frequencies of historical earthquakes to estimate the likelihood of future events.
Machine learning algorithms, including decision trees, neural networks, and support vector machines, analyse patterns in data to predict future occurrences of natural hazards. These algorithms can handle complex, nonlinear relationships between variables, making them well-suited for susceptibility analysis where multiple factors influence hazard occurrence.
Lombardo et al. (2020) demonstrated the use of machine learning for landslide susceptibility mapping in Sicily. By training a model with historical landslide occurrences and a range of environmental variables, they were able to predict areas at risk of future landslides with high accuracy. This approach allows for dynamic updating as new data become available, enhancing the model's predictive capability over time.
Data-driven models have significantly contributed to hazard mitigation efforts across various natural hazards, including floods, wildfires, and landslides. The table below highlights the use of probabilistic and machine learning models in evaluating susceptibility to floods and wildfires, showcasing significant projects and studies that contribute to disaster risk reduction and emergency preparedness.
Application of Data-Driven Models in Assessing Flood Risk and Wildfire Susceptibility.
|
Hazard Type |
Model Type |
Application |
Source |
|
Flood Risk Assessment |
Probabilistic and Machine Learning Models |
Used to assess flood susceptibility. The European Flood Awareness System (EFAS) provides early warnings for flood risks across Europe. |
European Flood Awareness System (EFAS) - European Commission, ongoing |
|
Wildfire Susceptibility |
Machine Learning Algorithms |
Applied to predict wildfire risks by analyzing vegetation, climate conditions, and human activities. Rodrigues and de la Riva (2014) utilised these models for wildfire susceptibility mapping. |
Rodrigues and de la Riva (2014) - Environmental Modelling & Software |
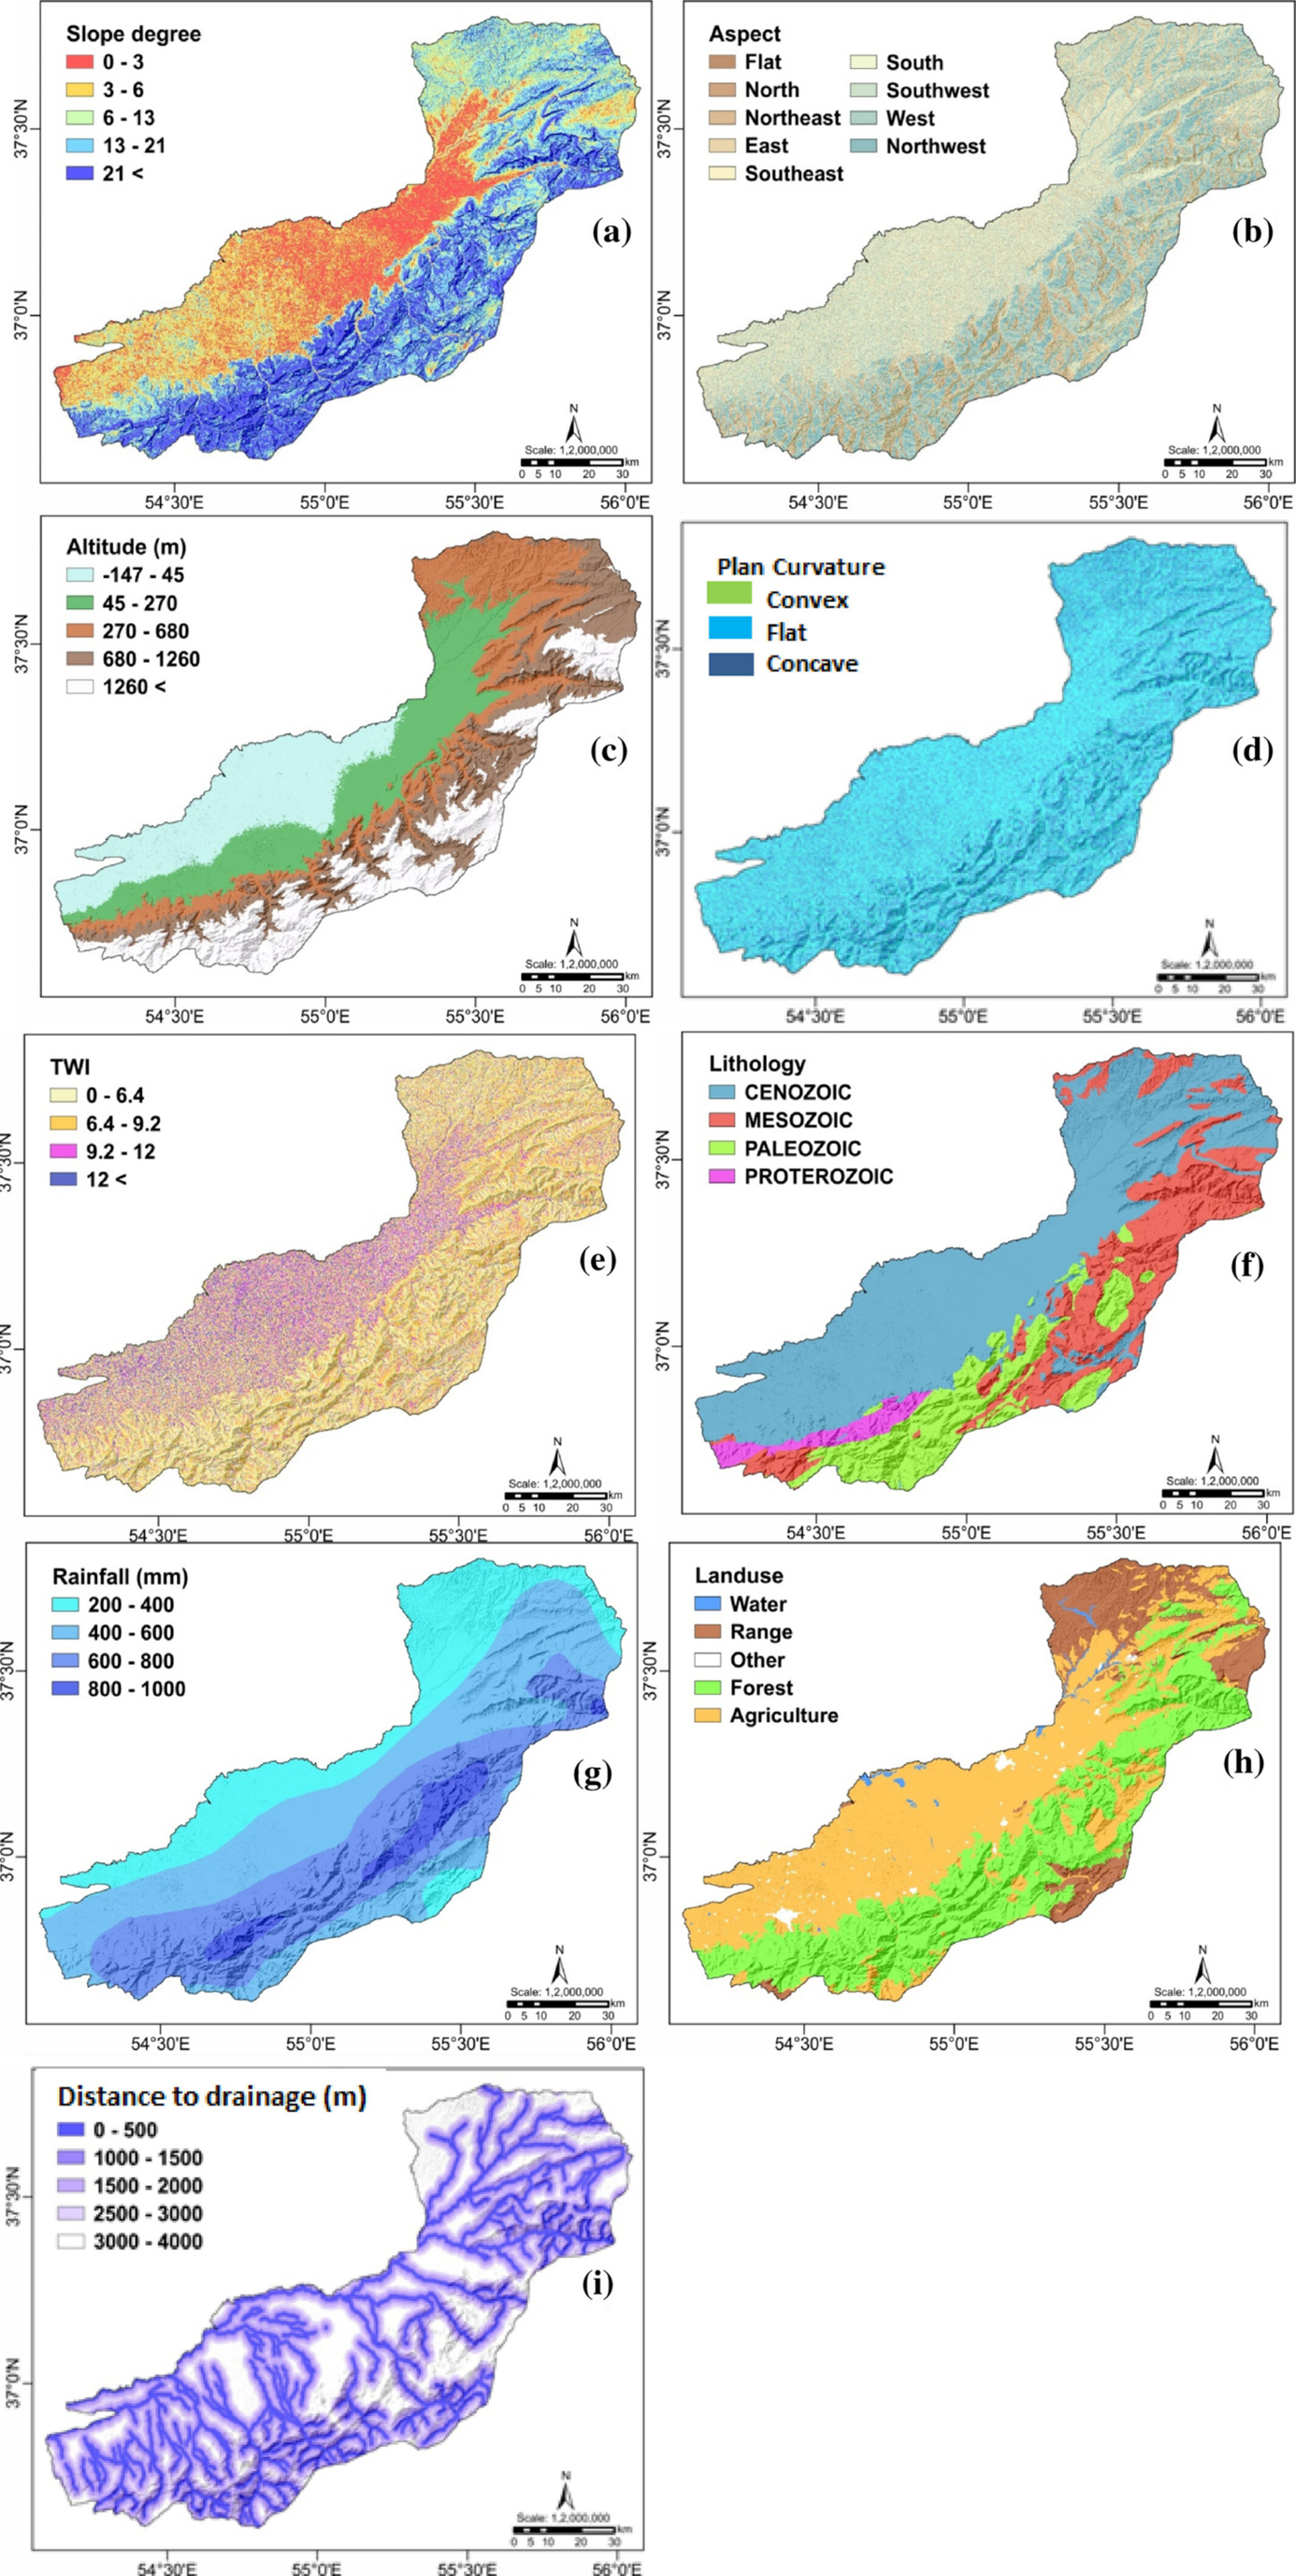
Key Factors Influencing Natural Hazard Susceptibility. An example of factors along with their categories that influence flood occurrence for a flood susceptibility map in Iran (Ahmadlou et al 2021).
The Himalayan region, characterised by its rugged terrain and heavy monsoon rains, is inherently prone to landslides. A susceptibility analysis here would involve mapping the region based on factors like slope steepness, soil type, land use, and vegetation cover to identify areas that are more likely to experience landslides. This type of analysis does not predict when landslides will occur or their potential severity but highlights areas where landslides are possible due to the inherent characteristics of the landscape.
GIS and remote sensing technologies are often used to create landslide susceptibility maps. These maps categorize areas into zones of varying susceptibility levels, such as low, moderate, high, and very high, based on the analysis of the mentioned factors.
Building on the susceptibility analysis, hazard analysis for landslides in the Himalayas would consider additional data like historical landslide occurrences, rainfall patterns (including intensity and duration), seismic activity, and changes in land use or vegetation cover to assess the likelihood of landslides happening in the future, their potential triggers, and the expected impact in terms of severity and extent.
This might involve the use of statistical models or machine learning algorithms that can analyse past landslide events in conjunction with real-time data (e.g., from weather stations or satellite imagery) to predict the probability of landslides in the susceptible areas identified earlier. Hazard analysis helps in estimating not only where and when landslides might occur but also their potential size and speed, which are crucial for risk assessment and planning evacuation routes.
Susceptibility analysis provides a baseline understanding of where landslides are more likely to occur based on terrain and environmental conditions. Hazard analysis builds on this by incorporating dynamic factors (like weather conditions) and historical data to predict the timing, frequency, and impact of landslides in those susceptible areas.
The combined insights from both analyses inform a range of risk reduction strategies. For instance, in highly susceptible and hazardous areas, authorities might restrict construction, implement engineering solutions like drainage systems or retaining walls, and develop early warning systems based on the triggers identified in the hazard analysis. In areas of moderate susceptibility, efforts might focus more on monitoring and preparedness, such as community training and the development of evacuation plans.
The integration of susceptibility and hazard analysis enables more targeted and effective risk management strategies. It ensures resources are allocated efficiently, enhances community preparedness, and ultimately reduces the potential loss of life and property damage from landslides.
Ahmadlou M, Al-Fugara A, Al-Shabeeb AR, et al (2021). Flood susceptibility mapping and assessment using a novel deep learning model combining multilayer perceptron and autoencoder neural networks. Journal of Flood Risk Management, 14(1), 1-21.
Brabb, E.E. (1985). "The World Landslide Problem." Episodes, 8(1), 33-36.
Carrara, A., Cardinali, M., Detti, R., Guzzetti, F., Pasqui, V., & Reichenbach, P. (1991). "GIS Techniques and Statistical Models in Evaluating Landslide Hazard." Earth Surface Processes and Landforms, 16(5), 427-445.
Ghosh, S., Carranza, E.J.M., van Westen, C.J., Jetten, V.G., & Bhattacharya, D.N. (2012). "Generating Event-Based Landslide Susceptibility Maps in a Data-Scarce Himalayan Environment for Estimating Temporal and Magnitude Probabilities." Environmental Earth Sciences, 66(8), 2353-2367.
Guzzetti, F., Carrara, A., Cardinali, M., & Reichenbach, P. (1999). "Landslide Hazard Evaluation: A Review of Current Techniques and Their Application in a Multi-Scale Study, Central Italy." Geomorphology, 31(1-4), 181-216.
Kainthura, P., Sharma, N. “Hybrid machine learning approach for landslide prediction, Uttarakhand, India.” Sci Rep 12, 20101 (2022).
Lombardo, L., Mai, P.M., & Dou, J. (2020). "Geo-Environmental Factors and Their Impact on Landslide Modeling." Geosciences, 10(2), 52.
Rodrigues, M., & de la Riva, J. (2014). "An Insight into Machine Learning Algorithms to Model Human-Caused Wildfire Occurrence." Environmental Modelling & Software, 57, 192-201.
USGS (ongoing). "Probabilistic Seismic Hazard Analysis (PSHA)." United States Geological Survey. Accessed [2024-02-12].