In the quest to better understand and mitigate the impacts of bushfires, Geoneon has developed a cutting-edge model designed to predict the severity of bushfires with unprecedented accuracy. The Geoneon Wildfire Severity model uses machine learning, high-resolution satellite imagery, and existing data sources as the basis of the model. To validate our model, we used the Delta Normalized Burn Ratio (dNBR) to evaluate against real-world case studies. Here, we delve into the methodology behind our model, its comparison with actual bushfire incidents, and the promising outcomes that emerged from this validation process.
Geoneon’s Wildfire Severity Model (Pre-Event)
Wildfire susceptibility severity mapping is a predictive tool designed to assess the potential catastrophic intensity of a wildfire if it were to occur (see the blog post on Susceptibility mapping for more information). Geoneon’s Wildfire Severity Model forecasts how severe a wildfire could become based on fuel availability and topography. The model combines high-resolution (50cm) satellite imagery, machine learning and conventional data sources (such as digital elevation models) to predict wildfire severity. It can be used to forecast areas that can be impacted by high-severity fires to support mitigation measures.
For a full explanation of the wildfire hazard severity index, you can visit the Greater Hobart Bushfire Exposure Index Understand the Index (geoneon.com).
Measuring Fire Severity (Post-Event)
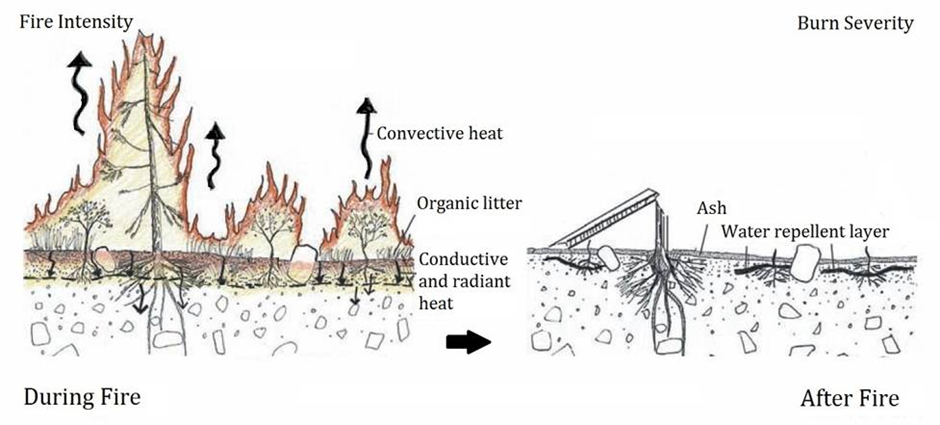
Fire intensity quantifies the energy output during the combustion of organic matter, reflecting the fire's active characteristics. Burn severity, in contrast, assesses the ecological consequences of fire intensity. It evaluates the extent to which fire alters ecosystem structure, function, and composition. Essentially, burn severity measures the degree of ecological change or disturbance resulting from a wildfire. Fire intensity is proportional to burn severity, the more intense a fire the more severe the burn scar. One of the most common ways of measuring forest fire severity is the Normalised Burn Ratio (NBR).
To validate the Geoneon wildfire severity model, we use the delta/differenced Normalized Burn Ratio (dNBR) which is a vital tool for assessing the extent and severity of wildfire damage when comparing satellite data from before and after a fire. The dNBR is derived from the following formula:

The NBR uses two data bands of satellite imagery, Near Infrared (NIR) and Shortwave Infrared (SWIR), to derive the index we use the following formula:

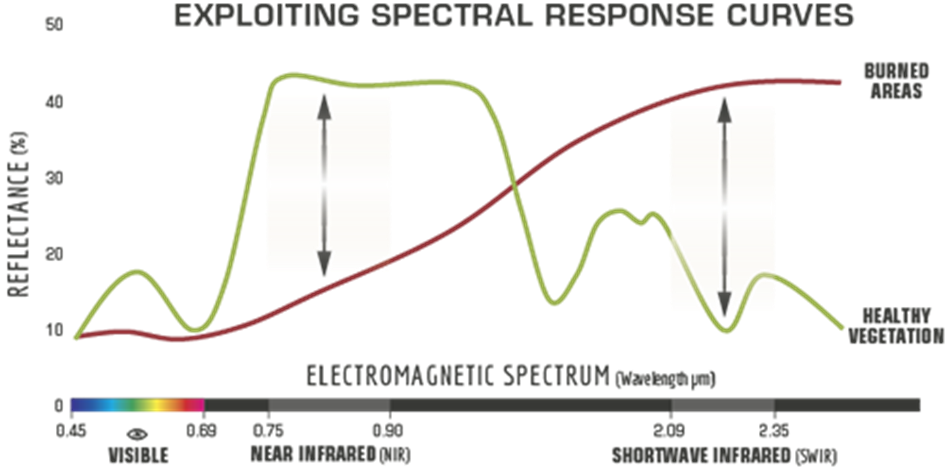
The NIR and SWIR parts of the electromagnetic spectrum are a powerful combination of bands to use for this index given vegetation reflects strongly in the NIR region of the electromagnetic spectrum and weekly in the SWIR. Alternatively, it has been shown that a fire scar which contains scarred woody vegetation and earth will reflect more strongly in the SWIR part of the electromagnetic spectrum and beyond (see figure below).
Its effectiveness hinges on the timing of data collection; it is most accurate when the data is gathered immediately before and after the fire event. As vegetation begins to regrow, the NBR's sensitivity decreases because the healthy plants reflect more in the Near-Infrared (NIR) spectrum due to chlorophyll. Consequently, in regions like Australia where vegetation recovery is slower, NBR provides more reliable data.
Real-life Case Studies/Validation
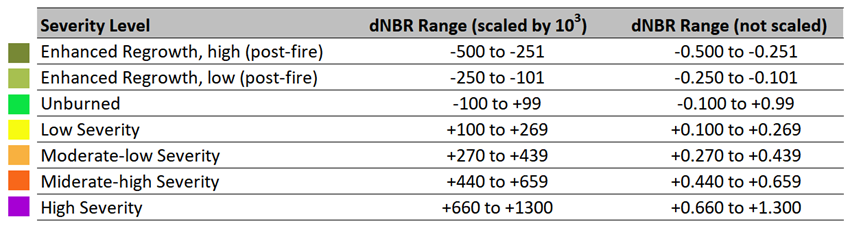
To validate our model, we compare the dNBR (post-event) with the Geoneon Wildfire Severity model output (pre-event) for the same area to derive how well our model predicts real world wildfire severity. The United States Geological Survey (USGS) proposed a classification table to interpret wildfire burn severity, which can be seen below. We use USGS definition of high severity (dNBR >= 0.660) to compare pre-event and post-event. The Geoneon model is static model and unlike a dynamic model doesn’t account for weather conditions, or firefighting interventions. In our analysis we don’t look at areas of lower severity, that would be influenced by these dynamic factors. The high-severity areas are also more important for overall exposure due to the link between severity and fire intensity.
To illustrate our model's validation process and its effectiveness in predicting real-world scenarios, we present two case studies: one from Tasmania, the home of Geoneon, and another from New South Wales during the devastating Black Summer bushfires. To assess the dNBR for our case studies, we leveraged Landsat 8 data (pre-2015, 30m resolution) and Sentinel-2 data (post-2015, 20m resolution), depending on their availability. For the Busby’s Flat study, we analysed data from three months before and after the fire event. In contrast, for the Dunalley study, we extended the comparison to six months pre-fire and post-fire, a modification necessitated by the limited availability of high-quality data. To mitigate the impact of cloud coverage and processing inaccuracies, we employed the median pixel value as a reliable measure. This approach ensures a more accurate representation of the affected areas, enhancing our analysis's overall robustness and reliability.
The notebooks for this can be found on GitHub. We calculated the NBR using Digital Earth Australia Analysis Ready Satellite data (ARD) from Digital Earth Australia to ensure precision and reliability in our findings.
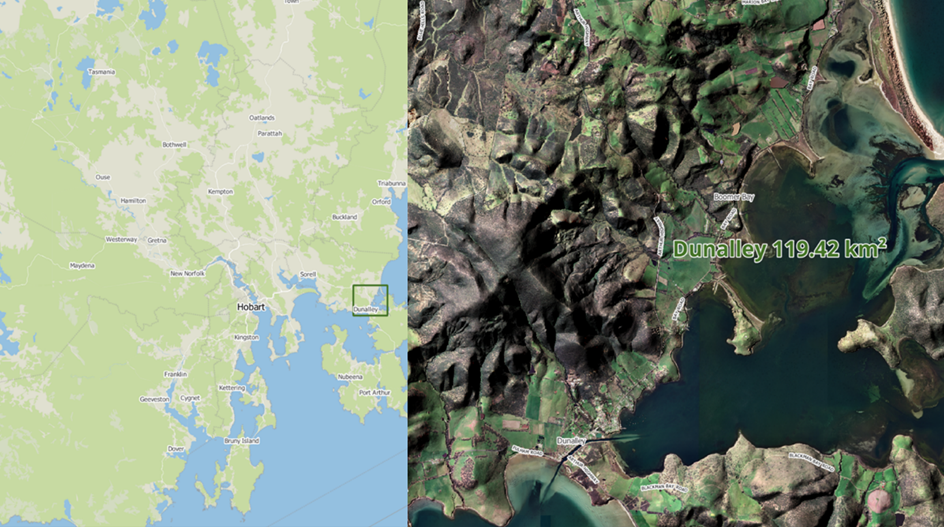
Dunalley – Tasmania (2013)
In January 2013, intense bushfires blazed in Tasmania. One of the hardest-hit towns was Dunalley, a fishing village on the eastern coast. A blaze destroyed 93 homes and 186 other buildings—about 30 per cent of the town— when it tore through the area on January 4, 2013 (summary in the Guardian).
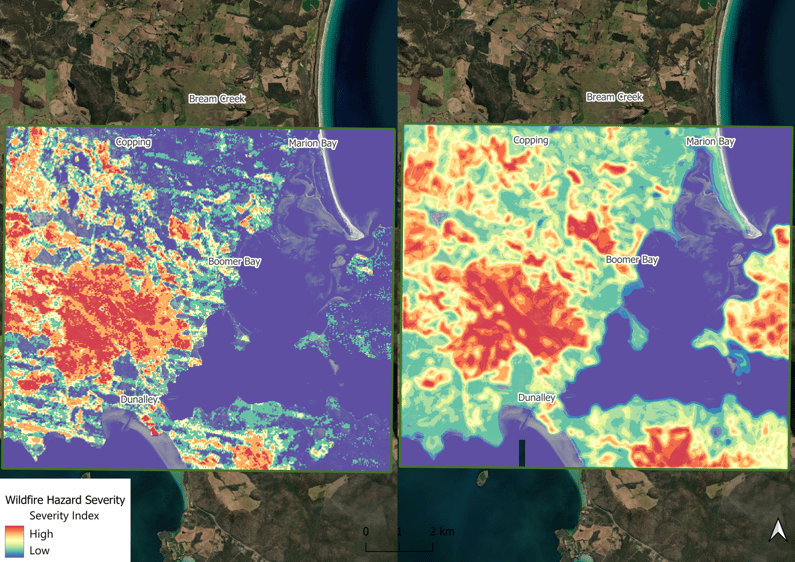
The image below shows the Dunalley dNBR (event date on 2013-01-04) versus the Geoneon wildfire severity model. There is a good alignment between low severity and high severity between the model and dNBR.
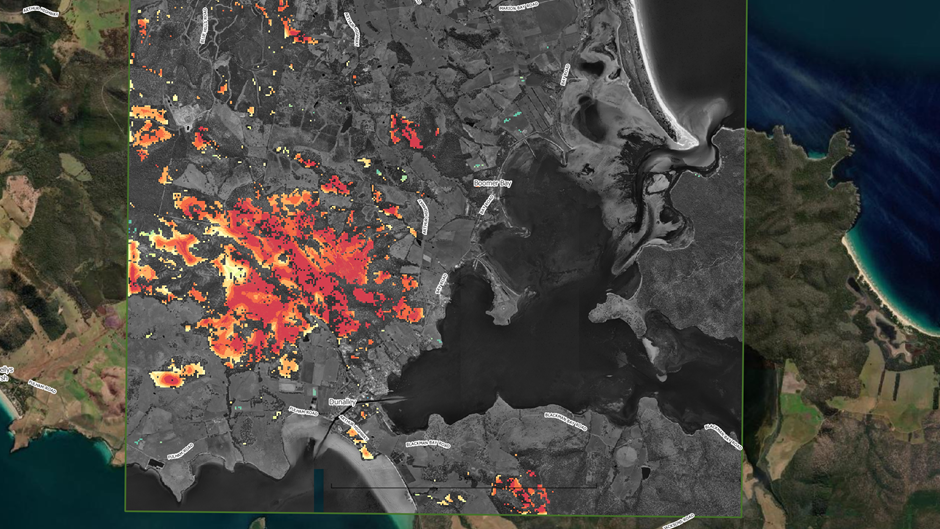
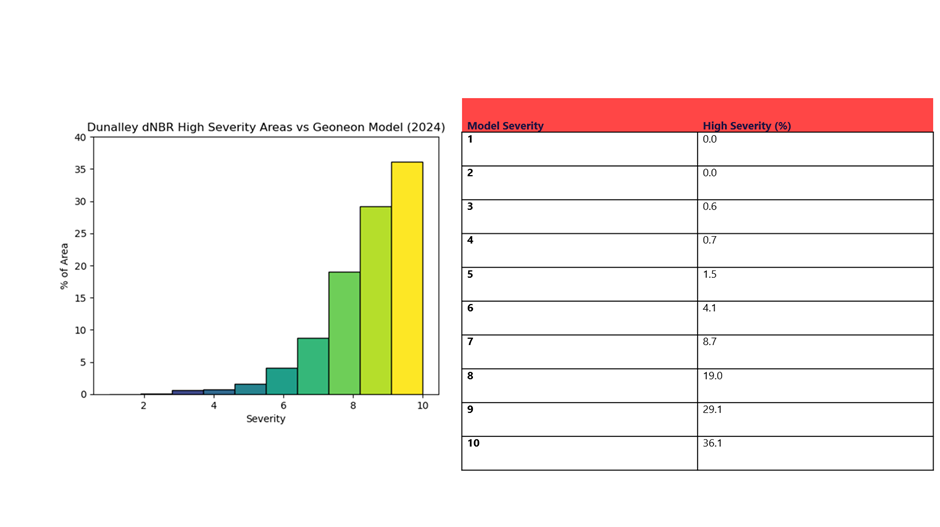
In the map below we masked the Geoneon wildfire severity model with the dNBR high severity areas allowing us to measure the number of pixels in high severity areas. Roughly 65% of the pixel values would be classified as high-severity in our model, and over 90% moderately high severity and above. Due to the difference in resolution between the Geoneon model and the imagery used to derive the dNBRwe expect some of the differences in the comparison to be a result of averaging pixels in the dNBR. It’s currently cost-prohibitive to acquire high-resolution dNBR data.
Busby’s Flat (2019-2020)
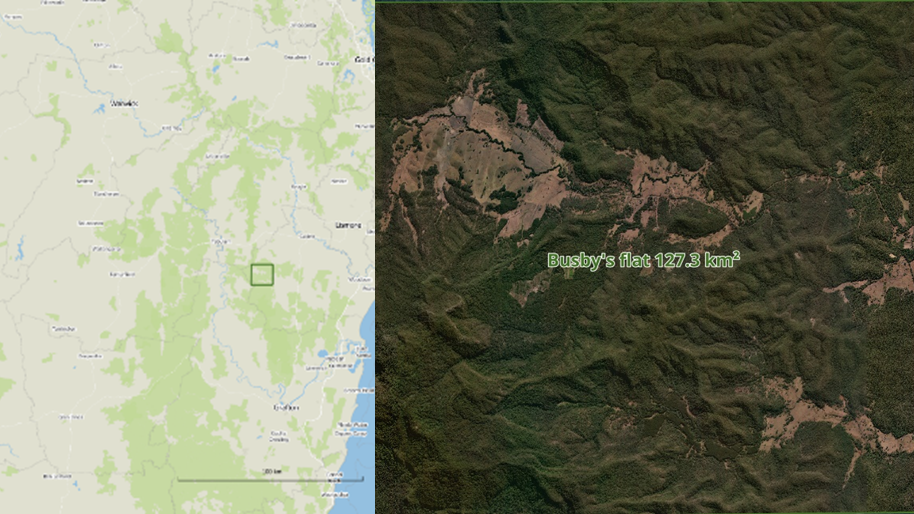
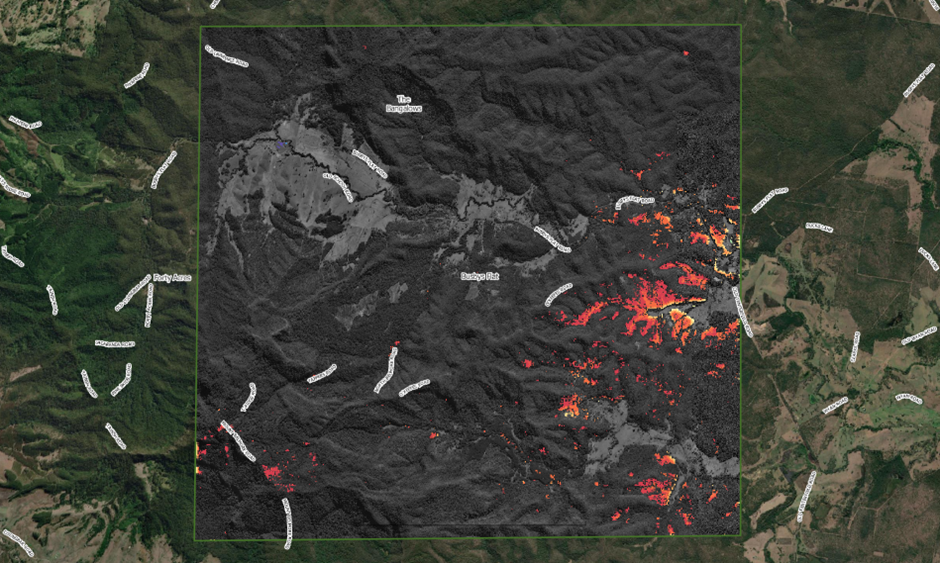
The 2019–20 Australian bushfire season, also referred to as Black Summer, was notably intense, marking a significant event in Australia's climatological records. Specifically, the fire in Busby’s Flat, Northern New South Wales, which occurred in October 2019, lasted for approximately two months. This event led to the burning of almost 50% of the 127 km² area, totalling around 60 km² of land affected. A number of properties were also lost in the fire Busbys Flat, Drake bushfires: Up to 20 properties lost | news.com.au — Australia’s leading news site. For a detailed analysis, refer to the document available at redeagle.com.au. The area surrounding Busby’s Flat is dense sclerophyll forest and heavily sloped, we can expect high severity in most of the surrounding area.
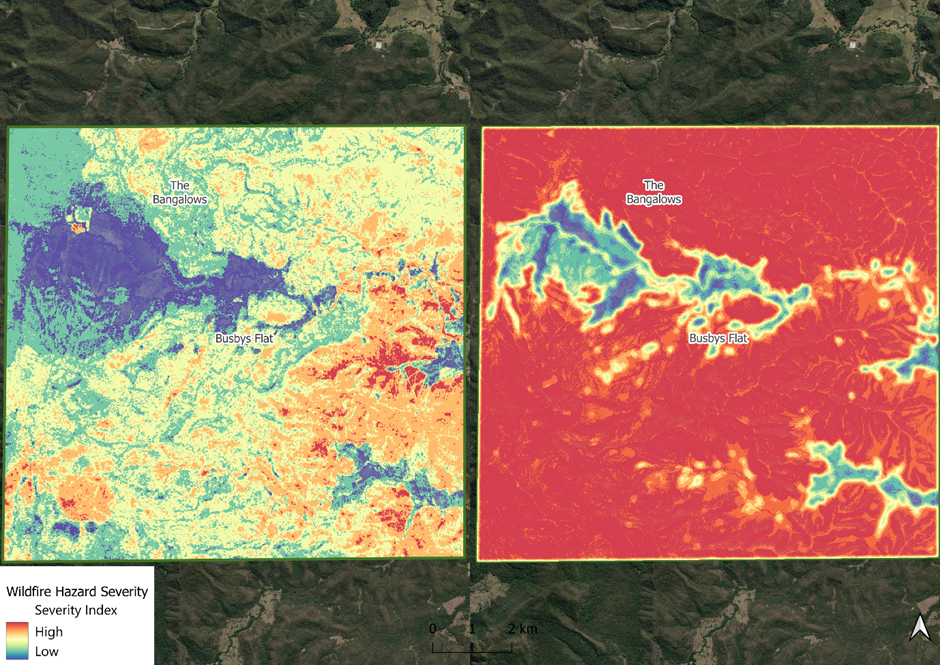
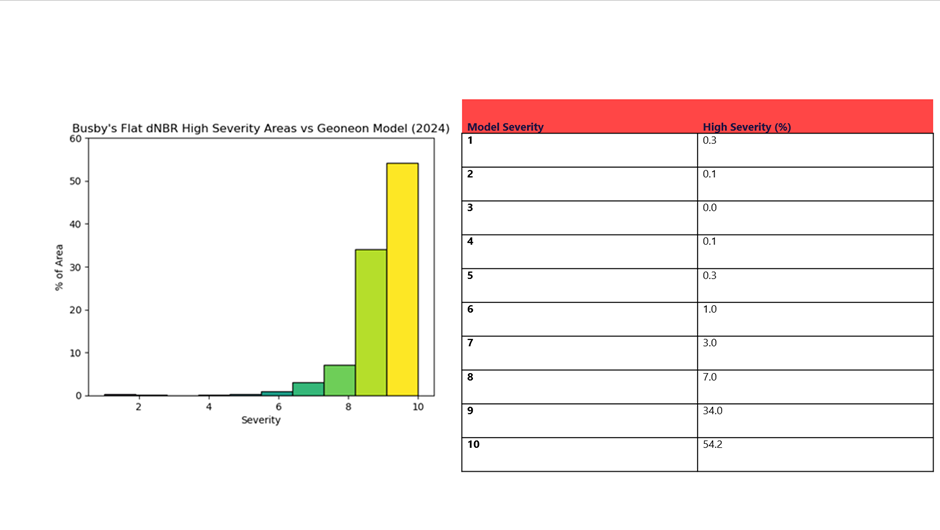
Below is a comparison of Busby’s Flat dNBR (event date 2019-10-03) versus Geoneon’s wildfire severity model. Again, we see good alignment in the lower severity between our model and real-world events. This case does highlight that our model is static, as roughly 80% of the model is high severity but in the dNBR, this is closer to 10%. When we look at high-severity areas where we can be sure there was fire burning intensely we see extremely good alignment between the dNBR and the Geoneon wildfire severity model.
Conclusion
We looked at real-life case studies of bushfires and compared them to the predictive power of Geoneon’s wildfire severity model. Overall the Geoneon Wildfire severity model performs extremely well at forecasting wildfire severity. Geoneon’s model was originally developed for urban and suburban areas but has shown to perform well also in rural areas. These examples underscore our model's capability to not only forecast bushfire severity but also to provide insights that could enhance preparedness and mitigate risks associated with property loss during such catastrophic events.
References