

Intense rain on steep, erodible slopes can set water, soil and rock in motion. A debris flow can begin in a confined source area, accelerate through a gully and spread into roads or developed land. For councils, the useful question is not simply whether that process is possible. It is where material could be mobilised, how far it could travel, which places deserve closer investigation and whether action may be required to reduce the risk.
Hobart City Council and Glenorchy City Council commissioned Geoneon to develop a regional, scenario-based view of rainfall-triggered debris-flow hazard across their municipal areas. The assessment was built as a screening and prioritisation tool. It helps connect a complex physical process to practical choices about field checks, asset review, planning and more detailed site investigation.
Turning a broad hazard into answerable questions
Greater Hobart combines steep terrain, developed foothills and a history of damaging high-intensity rainfall. What happens during an individual storm depends on several interacting factors: rainfall intensity and duration, antecedent wetness, topography, geology, vegetation, drainage and the amount of erodible material available.
The councils needed a consistent regional assessment to understand both current and future debris-flow risk, and that could address five connected questions:
- Where are plausible source areas?
- Which rainfall conditions could trigger mobilisation?
- Where might water and sediment run out?
- How do modelled intensity and sediment concentration combine into a hazard class?
- Which buildings and road corridors intersect mapped hazard areas and should be screened first?
Answering them at regional scale required a method that was repeatable and transparent about uncertainty, without implying property-level certainty.
Representing where material may be available
A debris-flow model needs more than a rainfall surface and a digital elevation model. It also needs a defensible representation of material that could be eroded and entrained. Geoneon developed a rule-based erodible-depth layer: an estimate of the maximum sediment thickness potentially available to the model at each grid cell. It is not a measurement of a particular deposit or a prediction of scour in a future event.
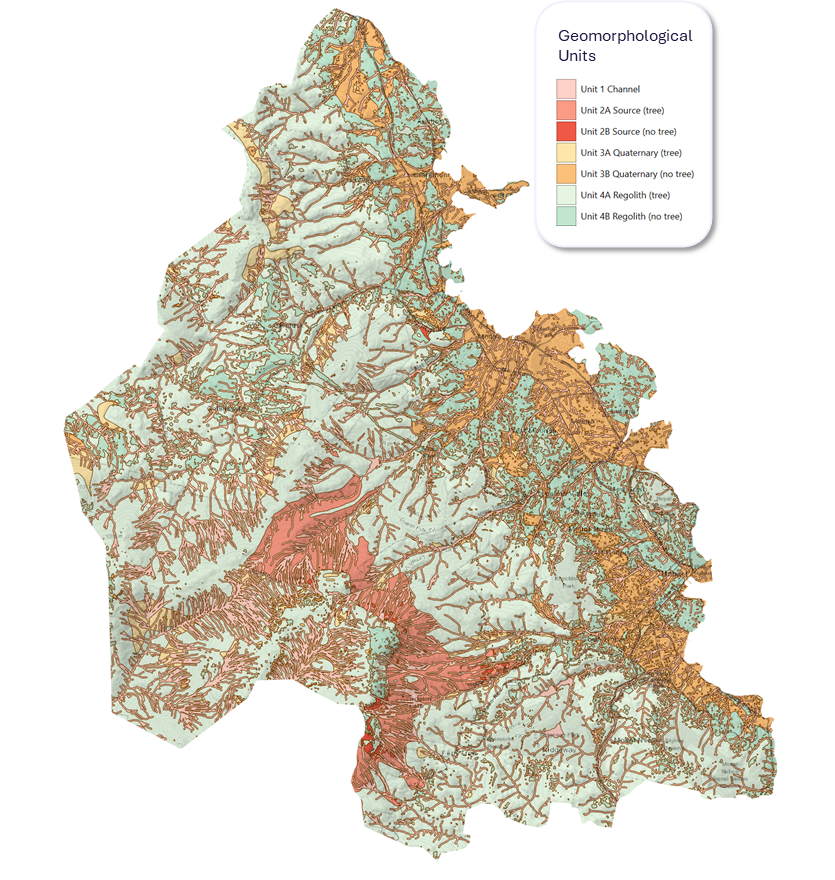
The layer combined a smoothed baseline soil depth with mapped geomorphological units. Background regolith, mapped source and accumulation areas, Quaternary soft deposits, stream cores and the areas around streams were treated differently. Tree cover reduced assumed availability in selected units, while dams were assigned no erodible depth so that the assessment did not inadvertently model dam failure. These rules are priority-driven and deliberately visible. They represent relative sediment availability, not universally calibrated physical constants.
Testing rainfall and runout together
The assessment used a two-dimensional numerical debris-flow model to represent rainfall-runoff-driven erosion, entrainment, transport and deposition across terrain. It considered current conditions and selected end-of-century climate scenarios: SSP3-7.0 and SSP5-8.5. For each climate condition, events with annual exceedance probabilities corresponding to 1-in-20, 1-in-100, 1-in-500 and 1-in-1,000-year return periods were modelled.
Calibration used the documented May 2018 Southern Tasmanian Extreme Weather Event footprint and rainfall-gauge evidence. This gave the team a real event against which to test the balance between simulated source activation and downstream runout. The regional simulations then applied that calibrated modelling framework consistently across the wider study area.
The model represents rainfall-triggered erosion and flow from the mapped material layer. It does not model every possible initiation mechanism, such as discrete deep-seated landslides, and it cannot fully reproduce the local influence of every drain, culvert, blockage or small structure.
From model outputs to six displayed hazard classes
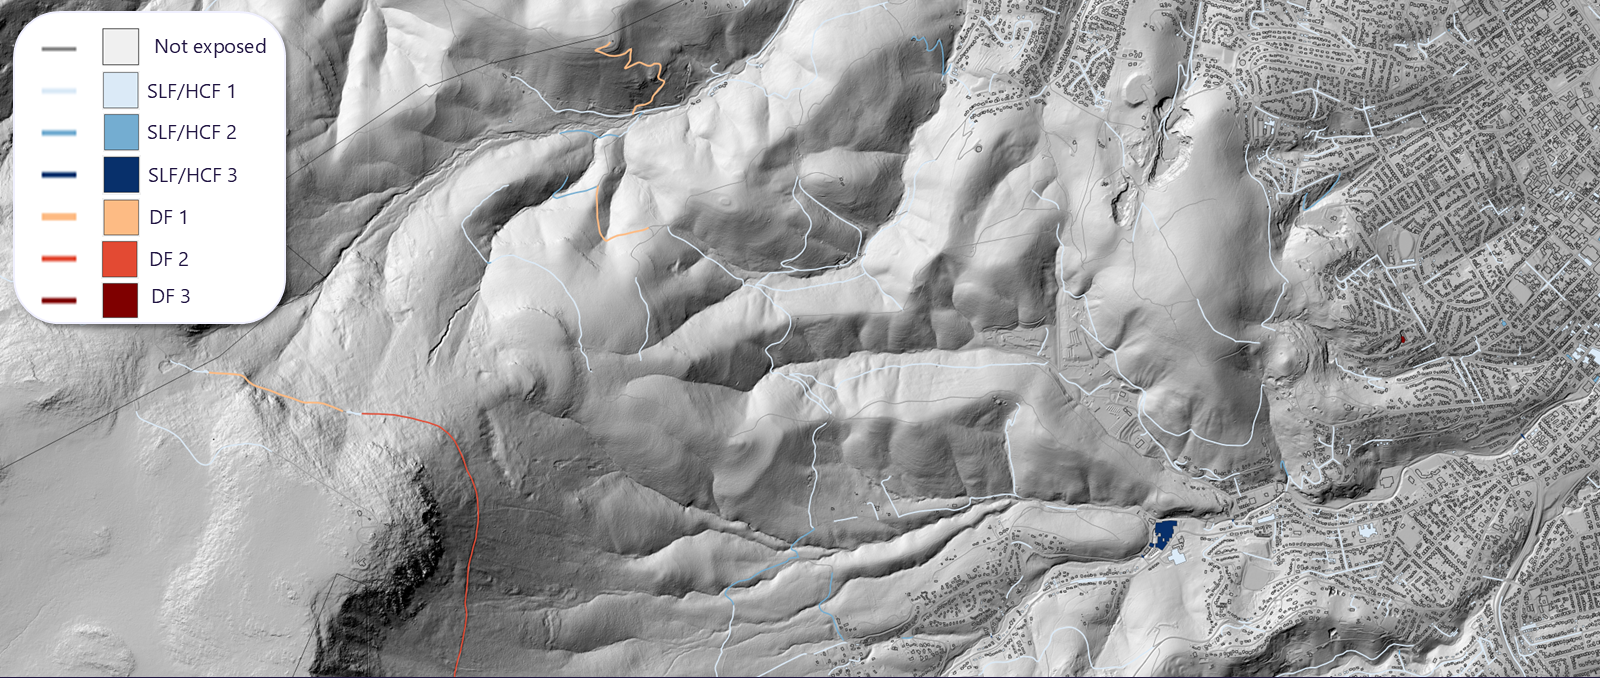
Depth, velocity and sediment concentration describe different parts of the process. The final methodology interprets concentration along a continuum from sediment-laden and hyperconcentrated flow to debris-flow-like conditions. For mapping, it combines concentration into two displayed process groups and applies three intensity levels.
In the final map legend, modelled concentrations from 10% to below 40% are combined as sediment-laden flow or hyperconcentrated flow (SLF/HCF); concentrations of 40% or more form the debris-flow group (DF). The adopted classification does not divide the displayed SLF/HCF group at 20%. Within each group, intensity uses I = h × v², where h is flow depth and v is velocity. The bands are 0 < I < 5 m³/s², 5 ≤ I < 24 m³/s² and I ≥ 24 m³/s², producing classes 1, 2 and 3.
The six displayed classes—SLF/HCF 1–3 and DF 1–3—preserve information that a single outline would hide. A broad area of lower-intensity sediment-laden flow has a different planning meaning from a smaller corridor of high-intensity debris flow. Colour, labels and class codes are used together so the distinction is not conveyed by colour alone.
What changed across the scenarios
Across all scenarios tested, the total mapped hazard area ranged from approximately 8.9 to 23.6 square kilometres. Under current conditions, the mapped area increased from about 8.9 square kilometres for the 1-in-20-year scenario to about 16.9 square kilometres for the 1-in-1,000-year scenario.
For the same modelled event likelihoods, the mapped area was approximately 28–33% larger under the selected SSP3-7.0 end-of-century scenarios and 40–48% larger under the selected SSP5-8.5 scenarios than under current conditions. The higher-return-period scenarios generally activated more source areas and extended the mapped downstream reach.
Within this modelling framework, the selected end-of-century climate scenarios therefore indicate a larger potential debris-flow hazard footprint than current conditions for the same modelled event likelihoods. The assessment specifically models debris-flow hazard; it does not quantify how climate change may affect other geotechnical hazards.
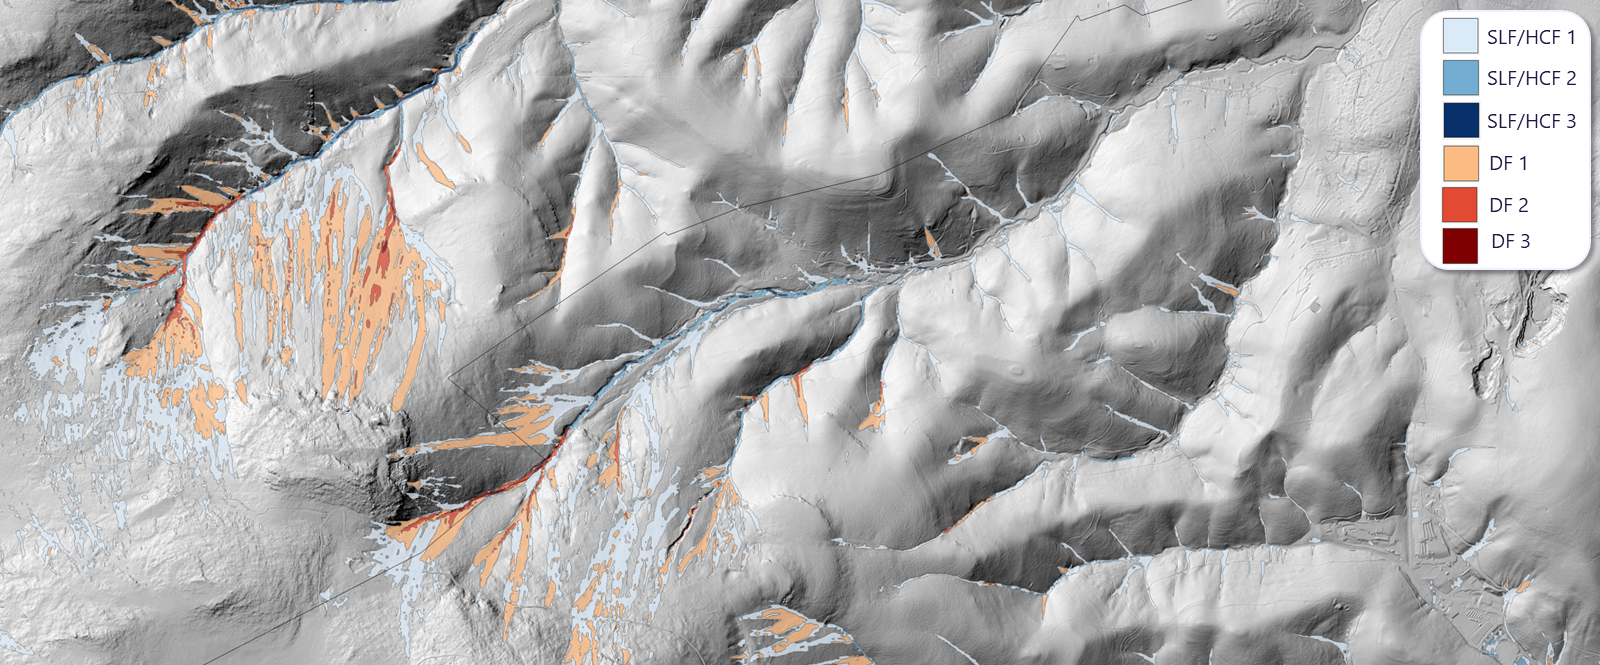
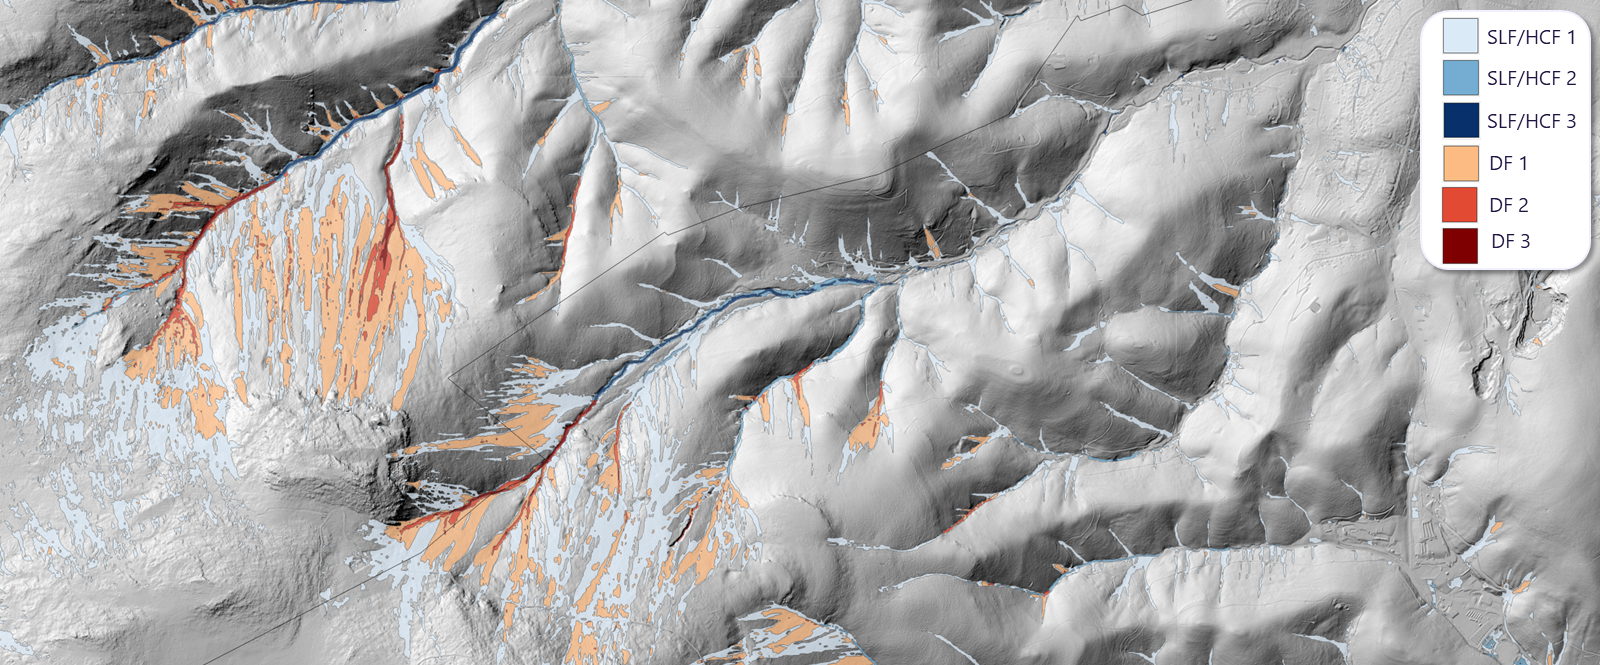
Most of the mapped area was in the lower SLF/HCF classes. Higher-intensity debris-flow classes occupied smaller areas, but represent the greatest potential for damage within the model’s classification. The comparison therefore matters in two ways: the total footprint changes, and so does the pattern of intensity within that footprint.
Screening exposure without overstating risk
The next step intersected building polygons and road centre-lines with the hazard classes. For each intersecting feature, the analysis recorded the highest mapped class and the affected area or length. That makes the output useful for sorting and review, but it remains an exposure screen.
An intersection does not by itself establish vulnerability, damage, loss, serviceability, consequence or the probability that an individual property will be affected. A road crossing a mapped corridor may warrant a drainage or field review; it does not automatically become an engineering conclusion. The value lies in narrowing a large regional problem to a smaller set of questions that can be checked with local knowledge and site evidence.
Decision value for councils
Used at the right scale, the assessment can support:
- comparison of relative change across return periods and climate scenarios;
- strategic land-use and infrastructure planning;
- prioritisation of field inspections and site-specific geotechnical or geomorphological assessment;
- screening of roads, buildings and catchments for further review;
- asset-management and adaptation discussions, including identifying locations where further investigation can determine whether dedicated mitigation works may be warranted; and
- clear communication about where regional evidence is useful and where more investigation is required.
For councils managing large and varied areas, that prioritisation can be as important as the model itself. It offers a consistent basis for deciding where limited investigation effort may add the most value.
Limits are part of the result
This is a regional, scenario-based assessment. It is not real-time prediction, an early-warning system, a property-level risk assessment, an engineering design or a declaration that a property is safe or unsafe. Results depend on rainfall inputs, terrain representation, assumptions about erodible material and simplified hydrological and flow processes.
Those limits are not a footnote. They define the responsible use of the work: as a transparent screening layer used alongside local knowledge, field evidence, asset information and more detailed assessment where the decision requires it.
A shared foundation for the next decision
This project was commissioned by the City of Hobart and Glenorchy City Council and delivered by Geoneon, with technical advice from Mineral Resources Tasmania. It builds on previous debris-flow work authored by Mineral Resources Tasmania and Geoneon/Terranum.
Funding acknowledgement: This project was funded by the Australian Government, City of Hobart and Glenorchy City Council. Australian Government funding was provided through Round 1 of the Disaster Ready Fund.